The project demonstrates practical skills in DAX time-intelligence measures, data modeling, interactive filtering, and dashboard UX design combined with Excel-based data preparation with Power BI's visualization and analytical capabilities.
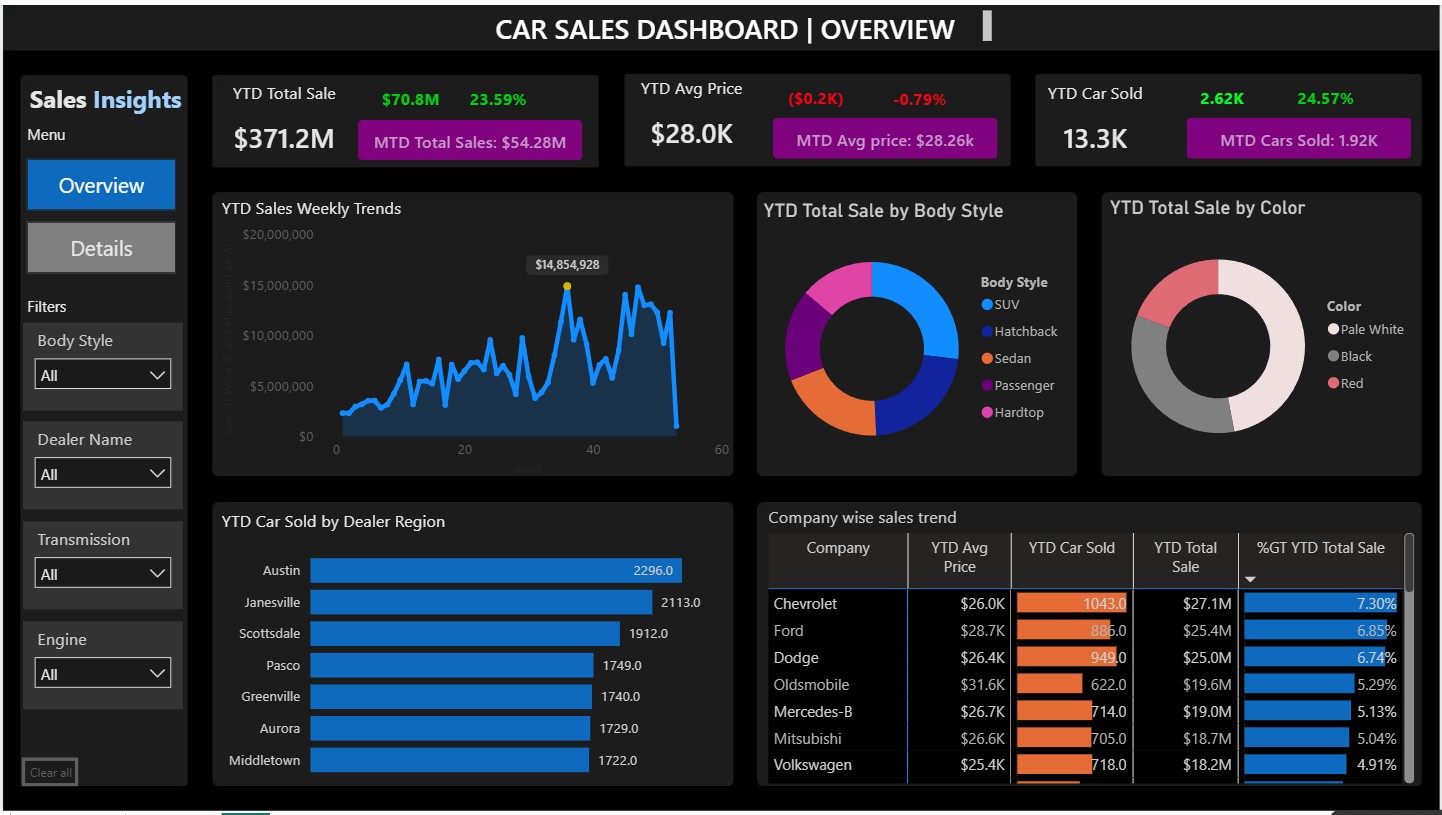
Project Title: Car Sales Dashboard
Tools Used
Microsoft Power BI (data modeling, DAX, visuals), Microsoft Excel (data cleaning and preparation)
Objective
The goal of this project was to build a centralized reporting tool that gives the sales/management team visibility into how car sales are performing across time, dealers, companies (brands), body styles, and colors, and to surface time-based comparisons (Year-over-Year, Month-to-Date, Prior-Year-to-Date) so the team can quickly spot growth, decline, and trends without manually pulling numbers from raw data.
Data Model & Approach
- Raw sales transaction data (car ID, date, customer, dealer, company, model, color, body style, transmission, engine, price) was cleaned and structured in Excel before being loaded into Power BI.
- A Date table was built to support time-intelligence DAX functions (YoY, MTD, PYTD).
- Interactive slicers/filters were added for Body Style, Dealer Name, Transmission, and Engine so users can dynamically explore the data.
- The report was split into two pages to separate a high-level executive summary (Overview) from a transaction-level drill-down (Details).
Key DAX Measures Implemented
Measure | Purpose |
YTD Total Sale | Cumulative sales revenue from the start of the year to the current/reporting date |
YoY Total Sale ($ and %) | Compares current YTD sales against the same period last year, in absolute $ and % growth |
YTD Avg Price | Average selling price per car, year-to-date |
YoY Avg Price ($ and %) | Change in average selling price compared to the prior year |
YTD Car Sold | Total number of units (cars) sold year-to-date |
YoY Car Sold (# and %) | Change in units sold compared to the same period last year |
MTD Total Sales | Sales revenue for the current month-to-date |
MTD Avg Price | Average price of cars sold in the current month-to-date |
MTD Cars Sold | Number of units sold in the current month-to-date |
PYTD Car Sold & Growth Rate | Prior-Year-to-Date car sales, used as the comparison base for YoY growth calculations |
Sales Difference (color-coded) | Conditional measure that returns green for positive variance and red for negative variance, used to instantly flag growth vs. decline |
Avg Price Growth | Growth rate of average price period-over-period |
% GT YTD Total Sale | Each company’s share of total YTD sales as a percentage of grand total (used in the company-wise trend table) |
These measures rely on Power BI time-intelligence patterns (e.g., TOTALYTD, SAMEPERIODLASTYEAR, DATEADD, and conditional IF/SWITCH logic for the color-coded variance indicators), layered on top of the custom Date table.
KPI Summary
KPI | Value | YoY Change | MTD Value |
YTD Total Sale | $371.2M | +$70.8M (+23.59%) | $54.28M |
YTD Avg Price | $28.0K | -$223.5 (-0.79%) | $28.26K |
YTD Car Sold | 13.3K | +2,616 (+24.57%) | 1.92K |
Note: The extremely large YoY Growth % figures (23.59% and -0.79%) indicate the prior-year comparison base was very small. This is common in a first full operating year or when historical data only partially covers the prior period. This is worth flagging in a real business review, since triple/quadruple-digit YoY growth is unusual and typically reflects a low or partial baseline rather than organic growth of that scale.
Visuals
- YTD Sales Weekly Trend (Line Chart): Tracks weekly revenue across ~52+ weeks, with a visible peak of $14,854,928 in a single week, the standout spike in the year’s performance.
- YTD Total Sale by Body Style (Donut Chart): Breaks down revenue across SUV, Hatchback, Sedan, Passenger, and Hardtop categories. And it shows that SUV is the most sold vehicle.
- YTD Total Sale by Color (Donut Chart): Shows sales split across Pale White, Black, and Red vehicles, highlighting customer color preference.
- YTD Car Sold by Dealer Region (Bar Chart): Ranks dealer regions by units sold:
- Austin: 2,296
- Janesville: 2,113
- Scottsdale: 1,912
- Middletown: 1,722
- Aurora: 1,729
- Greenville: 1,740
- Pasco: 1,749
Austin is the clear top-performing region, roughly 33% ahead of the lowest performer (Middletown).
Company-wise Sales Trend: Ranks brands by contribution to total sales:
Company | YTD Avg Price | YTD Car Sold | % YTD Total Sale |
Chevrolet | $25,994.70 | 1043 | 7.30% |
Ford | $28,701.20 | 886 | 6.85% |
Dodge | $26,361.90 | 949 | 6.74% |
Oldsmobile | $31,555.10 | 622 | 5.29% |
Mercedes-B | $26,653.90 | 714 | 5.13% |
Mitsubishi | $26,557.40 | 705 | 5.04% |
Volkswagen | $25,396.00 | 718 | 4.91% |
Toyota | $29,515.50 | 593 | 4.72% |
- Chevrolet leads both in units sold and total revenue, while Oldsmobile commands the highest average price point despite lower volume, suggesting a premium/low-volume positioning.
Filters
Body Style, Dealer Name, Transmission, Engine (interactive slicers applied across all Page 1 visuals).
Page 2: Details
Transaction-Level Table
A detailed drill-through table listing individual sales transactions with:
- Car ID, Sale Date, Customer Name, Dealer Name, Company, Color, Model, and Total Sale value.
- The sample view shows transactions from January to March 2022 across dealers such as Saab-Belle Dodge, U-Haul CO, Diehl Motor CO Inc, and Enterprise Rent A Car.
- The filtered subtotal for this selection is $671,525.47, confirming the table dynamically recalculates totals based on active filters/slicers.
Filters
Same slicer set as Page 1 (Body Style, Dealer Name, Transmission, Engine), allowing the user to move from a high-level KPI view into the exact transactions behind any number.
Key Insights
- Austin is the top-performing dealer region by units sold (2,296), giving the sales team a clear signal on where volume is concentrated.
- Chevrolet is the leading brand by both revenue ($27.1M) and volume (1,043 units), while Oldsmobile achieves the highest average price per unit ($31.6K) despite lower sales volume, a useful contrast between volume-driven and price-driven brand performance.
- Average price is trending slightly down both YTD (-0.79% on Overview, -0.79% on Details) even as total sales and units sold are rising, indicating growth is being driven by volume rather than price increases.
- A single week spiked to $14.85M in revenue, more than 3x the typical weekly run rate visible in the trend line, worth investigating as either a bulk/fleet sale or a data anomaly.
- Color and body style preferences (Pale White dominant; SUV/Sedan/Hardtop leading body styles) give the team direction for inventory and marketing focus.
Conclusion
This dashboard consolidates raw transactional car sales data into a two-page, filter-driven Power BI report that enables a sales team to:
- Monitor real-time performance against prior periods (YoY, MTD, PYTD) using dynamic DAX measures.
- Identify top and bottom performing dealer regions and brands at a glance.
- Drill from summary KPIs directly into transaction-level detail for investigation.
- Make faster, evidence-based decisions on inventory, regional focus, and brand strategy.